原始檔案 (SVG 檔案,表面大小:360 × 315 像素,檔案大小:27 KB)


摘要

描述
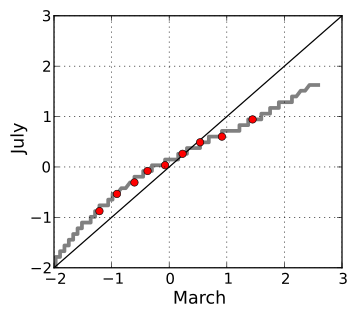
English: A quantile-quantile plot comparing the distributions of daily maximum temperature in the U.S. state of Ohio in March and in July.
日期
來源 自己的作品
作者 Skbkekas
SVG開發
InfoField
 
SVG檔案的原始碼通過W3C驗證
 
vector image使用Matplotlib創作。
原始碼
InfoField

Python code

## "state33" data file obtained from: ftp://ftp.ncdc.noaa.gov/pub/data/ushcn/daily/README

import gzip
import numpy as np
import matplotlib.pyplot as plt

fid = gzip.open("state33.gz")

month1 = 3
month2 = 7

M1,M2 = [],[]
for line in fid:

    stid = int(line[0:7])

    if line[7:11]=="TMAX":
        mo = int(line[17:19])
        nday = int(line[20:22])
        if mo not in [month1,month2]: continue
        V,ii = [],26
        for k in range(nday):
            V.append(float(line[ii:ii+2]))
            ii += 8
        if mo==month1: M1.extend(V)
        if mo==month2: M2.extend(V)

M1 = np.array(np.sort(M1))
M2 = np.array(np.sort(M2))

M1 = M1[M1!=99]
M2 = M2[M2!=99]

M1 = (M1-M1.mean())/M1.std()
M2 = (M2-M2.mean())/M2.std()

Q1 = [M1[int(q*len(M1))] for q in np.arange(1,1000,dtype=np.float64)/1000]
Q2 = [M2[int(q*len(M2))] for q in np.arange(1,1000,dtype=np.float64)/1000]

P1 = [M1[int(q*len(M1))] for q in np.arange(1,10,dtype=np.float64)/10]
P2 = [M2[int(q*len(M2))] for q in np.arange(1,10,dtype=np.float64)/10]

plt.clf()
plt.figure(figsize=(4,3.5))
plt.axes([0.15,0.15,0.8,0.8])
plt.grid(True)
plt.plot(Q1, Q2, '-', color="gray", lw=3)
plt.hold(True)
plt.plot([-3,3], [-3,3], '-', color='black')
plt.plot(P1, P2, 'o', mec='black', mfc='red')
plt.xlim(-2,3)
plt.ylim(-2,3)
plt.xlabel("March", size=14)
plt.ylabel("July", size=14)
plt.savefig("ohio_temps_qq.pdf")
plt.savefig("ohio_temps_qq.svg")

授權條款

我,本作品的著作權持有者,決定用以下授權條款發佈本作品:
w:zh:創用CC
姓名標示
此檔案採用創用CC 姓名標示 3.0 未在地化版本授權條款。
您可以自由:
  • 分享 – 複製、發佈和傳播本作品
  • 重新修改 – 創作演繹作品
惟需遵照下列條件:
  • 姓名標示 – 您必須指名出正確的製作者,和提供授權條款的連結,以及表示是否有對內容上做出變更。您可以用任何合理的方式來行動,但不得以任何方式表明授權條款是對您許可或是由您所使用。

說明

添加單行說明來描述出檔案所代表的內容

在此檔案描寫的項目

描繪內容

創用CC姓名標示3.0未本地化 繁體中文 (已轉換拼寫)

檔案歷史

點選日期/時間以檢視該時間的檔案版本。

日期/時間縮⁠圖尺寸使用者備⁠註
目前2009年11月13日 (五) 14:52於 2009年11月13日 (五) 14:52 版本的縮圖360 × 315(27 KB)Skbkekas{{Information |Description={{en|1=A quantile-quantile plot comparing the distributions of daily maximum temperature in the U.S. state of Ohio in March and in July.}} |Source={{own}} |Author=Skbkekas |Date=2009-11-13 |Permission= |other_v

下列頁面有用到此檔案:

全域檔案使用狀況

以下其他 wiki 使用了這個檔案: