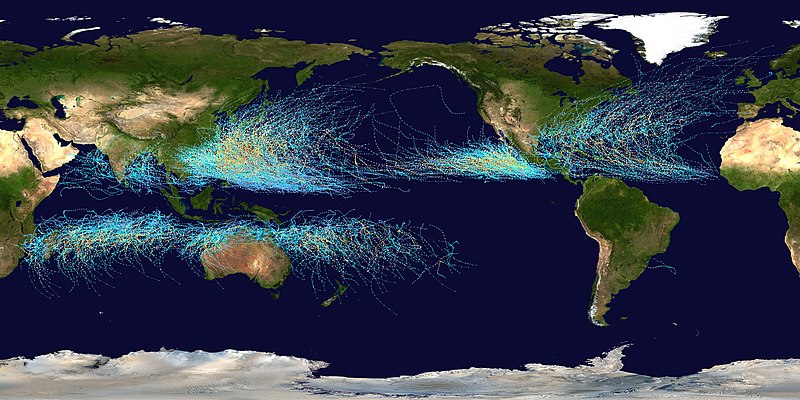
File:Global tropical cyclone tracks-edit2.jpg

預覽大小:800 × 400 像素。 其他解析度:320 × 160 像素 | 640 × 320 像素 | 1,024 × 512 像素 | 1,280 × 640 像素 | 2,560 × 1,280 像素 | 8,000 × 4,000 像素。
原始檔案 (8,000 × 4,000 像素,檔案大小:5.73 MB,MIME 類型:image/jpeg)
檔案歷史
點選日期/時間以檢視該時間的檔案版本。
| 日期/時間 | 縮圖 | 尺寸 | 用戶 | 備註 | |
|---|---|---|---|---|---|
| 目前 | 2020年3月19日 (四) 12:10 |  | 8,000 × 4,000(5.73 MB) | Supportstorm | Reverted to version as of 00:36, 5 August 2006 (UTC) |
| 2020年2月27日 (四) 01:40 |  | 1,920 × 960(482 KB) | JDD Sicko | ok some body update this its almost 15 years old * also i made no changes * | |
| 2006年8月5日 (六) 00:36 |  | 8,000 × 4,000(5.73 MB) | Nilfanion | == Summary == This map shows the tracks of all Tropical cyclones which formed worldwide from 1985 to 2005. The points show the locations of the storms at six-hourly intervals and use the color scheme from [[w:Saffir-Simpson Hurrican |
檔案用途
超過 100 個頁面有用到此檔案。 下列清單只列出前 100 筆有用到此檔案的頁面。 您也可以檢視完整清單。
- 1960年太平洋颱風季
- 1972年太平洋颱風季
- 1979年太平洋颱風季
- 1986年太平洋颱風季
- 1993年太平洋颱風季
- 1994年太平洋颱風季
- 1995年太平洋颱風季
- 1996年太平洋颱風季
- 1997年太平洋颱風季
- 1998年太平洋颱風季
- 1999年太平洋颱風季
- 2000年太平洋颱風季
- 2001年太平洋颱風季
- 2002年太平洋颱風季
- 2003年大西洋飓风季
- 2003年太平洋颱風季
- 2004年大西洋颶風季
- 2004年太平洋颱風季
- 2005年大西洋颶風季
- 2005年太平洋颱風季
- 2006—2007年南太平洋熱帶氣旋季
- 2006—2007年澳洲地區熱帶氣旋季
- 2006—2007年西南印度洋熱帶氣旋季
- 2006年大西洋颶風季
- 2006年大西洋飓风季时间轴
- 2006年太平洋颱風季
- 2007—2008年南太平洋熱帶氣旋季
- 2007—2008年澳洲地區熱帶氣旋季
- 2007—2008年西南印度洋熱帶氣旋季
- 2007年大西洋颶風季
- 2007年大西洋飓风季时间轴
- 2007年太平洋颱風季
- 2008—2009年澳洲地區熱帶氣旋季
- 2008—2009年西南印度洋熱帶氣旋季
- 2008年大西洋颶風季
- 2008年大西洋飓风季时间轴
- 2008年太平洋颱風季
- 2009—2010年南太平洋熱帶氣旋季
- 2009—2010年澳洲地區熱帶氣旋季
- 2009—2010年西南印度洋熱帶氣旋季
- 2009年大西洋颶風季
- 2009年太平洋颱風季
- 2010年太平洋颱風季
- 冬季
- 冰雹
- 冷锋
- 冻雨
- 卷云
- 塵捲風
- 夏季
- 天气
- 天气预报
- 天氣現象
- 太平洋颱風季
- 季节
- 季风
- 寒潮
- 层云
- 干旱
- 旱季
- 春季
- 暴雨
- 极夜
- 极昼
- 毛毛雨
- 气象学
- 氣候
- 沙尘暴
- 海龍捲風
- 溫帶氣旋
- 火災暴風
- 热浪
- 熱帶氣旋
- 秋季
- 积云
- 空氣污染
- 降水
- 雨
- 雨夾雪
- 雨季
- 雪
- 雪暴
- 雷打雪
- 雷暴
- 雾凇
- 霜
- 霧
- 霰
- 露水
- 風
- 颱風
- 风暴
- 风暴潮
- 龍捲風
- User:C933103/maps
- User:Teddythtam2003/Sandbox/2006年太平洋颱風季
- Wikipedia:特色圖片評選/存檔/2008年11月
- Wikipedia:特色圖片評選/熱帶氣旋分佈圖
- Template:天氣
- Template:太平洋颱風季
檢視連結到這個檔案的更多連結。
全域檔案使用狀況
以下其他 wiki 使用了這個檔案:
- af.wiki.x.io 的使用狀況
- als.wiki.x.io 的使用狀況
- ar.wiki.x.io 的使用狀況
- إعصار قمعي
- عاصفة ثلجية
- خريف
- شتاء
- مناخ
- علم الأرصاد الجوية
- ثلج
- سحاب
- صيف
- تلوث الهواء
- مطر
- ربيع
- فصول السنة
- فيزياء الغلاف الجوي
- برد (هطول)
- عاصفة رملية
- ضباب
- موسم جاف
- موسم رطب
- عاصفة رعدية
- إعصار استوائي
- توقع جوي
- نيزك جليدي ضخم
- قالب:طقس
- السحابة الخارقة
- هبوب
- دمق
- مناخ أصغري
- هرمتان (رياح)
- شاهقة مائية
- انقلاب صيفي
- غبار الألماس
- برد دقيق
- مطر متجمد
- حبيبات جليدية
- رذاذ متجمد
- مزن ركامي
- عاصفة جليدية
- موجة حر
- موجة برد
- عاصفة نارية
- خليط المطر والثلج
- انقلاب شتوي
- طقس قاس
- رذاذ
- حبيبات ثلجية
- لفافة ثلج
檢視此檔案的更多全域使用狀況。


