File:Uranus Seasonal variability.png
原始檔案 (1,753 × 1,237 像素,檔案大小:19 KB,MIME 類型:image/png


描述
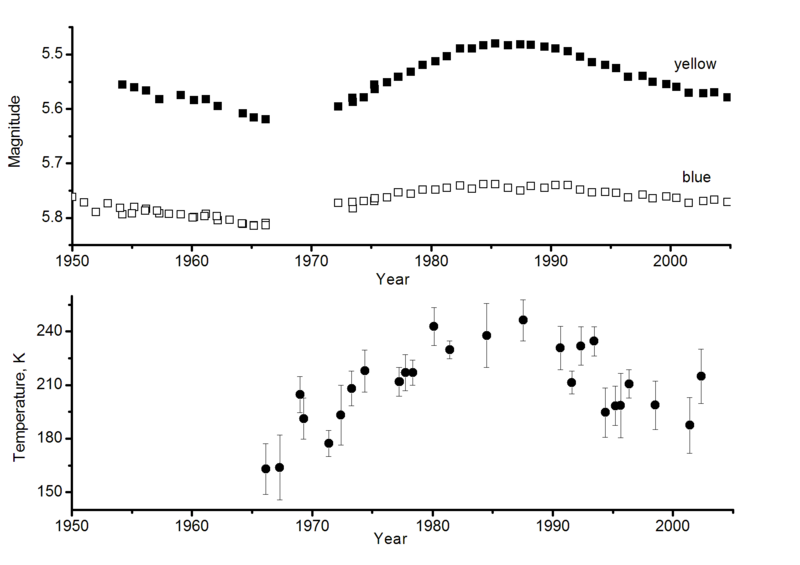
Deutsch: Dieses Bild stellt Änderungen der scheinbaren Helligkeit in den zwei Spektralbändern dar (obere Grafik) und die effektive Mikrowellentemperatur (untere Grafik). Die Daten, die hier gezeigt werden, sind von:

Lockwood, G.W.; Jerzykiewicz, Mikołaj (2006). "Photometric variability of Uranus and Neptune, 1950–2004". Icarus 180: 442-452. DOI:10.1016/j.icarus.2005.09.009 (Tables 1-3)

und Klein, M.J.; Hofstadter, M.D. (2006) "Long-term variations in the microwave brightness temperature of the Uranus atmosphere". Icarus 184: 170-180. DOI:10.1016/j.icarus.2006.04.012. (Tables 1-2).
English: This image depicts changes of the visible magnitude of Uranus in the two spectral bands (upper graph) and effective microwave temperature (lower graph). The data shown here are from

Lockwood, G.W.; Jerzykiewicz, Mikołaj (2006). "Photometric variability of Uranus and Neptune, 1950–2004". Icarus 180: 442-452. DOI:10.1016/j.icarus.2005.09.009 (Tables 1-3)

and Klein, M.J.; Hofstadter, M.D. (2006) "Long-term variations in the microwave brightness temperature of the Uranus atmosphere". Icarus 184: 170-180. DOI:10.1016/j.icarus.2006.04.012. (Tables 1-2).
日期
來源 English Wikipedia
作者 Ruslik0
授權許可
(重用此檔案)
English Wikipedia 使用者 Ruslik0,此作品的版權所有人,決定用以下授權條款發佈本作品:
GNU head 已授權您依據自由軟體基金會發行的無固定段落、封面文字和封底文字GNU自由文件授權條款1.2版或任意後續版本,對本檔進行複製、傳播和/或修改。該協議的副本列在GNU自由文件授權條款中。
w:zh:創用CC
姓名標示 相同方式分享
此檔案採用創用CC 姓名標示-相同方式分享 3.0 未在地化版本授權條款。
姓名標示: English Wikipedia 使用者 Ruslik0
您可以自由:
  • 分享 – 複製、發佈和傳播本作品
  • 重新修改 – 創作演繹作品
惟需遵照下列條件:
  • 姓名標示 – 您必須指名出正確的製作者,和提供授權條款的連結,以及表示是否有對內容上做出變更。您可以用任何合理的方式來行動,但不得以任何方式表明授權條款是對您許可或是由您所使用。
  • 相同方式分享 – 若要根據本素材進行再混合、轉換或創作,則必須以與原作相同或相容的授權來發布您的作品。
已新增授權條款標題至此檔案,作為GFDL授權更新的一部份。

說明

添加單行說明來描述出檔案所代表的內容

在此檔案描寫的項目

描繪內容

檔案歷史

點選日期/時間以檢視該時間的檔案版本。

日期/時間縮⁠圖尺寸使用者備⁠註
目前2008年12月1日 (一) 04:57於 2008年12月1日 (一) 04:57 版本的縮圖1,753 × 1,237(19 KB)Kakoui{{Information |Description=This image depicts changes of the visible magnitude of Uranus in the two spectral bands (upper graph) and effective microwave temperature (lower graph). The data shown here are from Lockwood, G.W.; Jerzykiewicz, Mikołaj (2006)

下列頁面有用到此檔案:

全域檔案使用狀況

以下其他 wiki 使用了這個檔案: