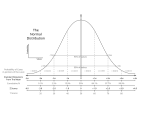
File:Normal distribution and scales.gif

本预览的尺寸:800 × 458像素。 其他分辨率:320 × 183像素 | 640 × 366像素 | 1,200 × 687像素。
原始文件 (1,200 × 687像素,文件大小:39 KB,MIME类型:image/gif)
文件历史
点击某个日期/时间查看对应时刻的文件。
| 日期/时间 | 缩略图 | 大小 | 用户 | 备注 | |
|---|---|---|---|---|---|
| 当前 | 2006年3月20日 (一) 18:12 |  | 1,200 × 687(39 KB) | Maksim | La bildo estas kopiita de wikipedia:en. La originala priskribo estas: == Summary == A chart comparing the various grading methods in a normal distribution. Includes: Standard deviations, cummulative precentages, percentile equivalents, Z-scores, T-scores |
文件用途
以下页面使用本文件:
全域文件用途
以下其他wiki使用此文件:
- ar.wiki.x.io上的用途
- ca.wiki.x.io上的用途
- de.wiki.x.io上的用途
- dv.wiki.x.io上的用途
- en.wiki.x.io上的用途
- eo.wiki.x.io上的用途
- es.wiki.x.io上的用途
- fr.wiki.x.io上的用途
- gl.wiki.x.io上的用途
- he.wikibooks.org上的用途
- he.wiktionary.org上的用途
- ko.wiki.x.io上的用途
- mr.wiki.x.io上的用途
- mwl.wiki.x.io上的用途
- pl.wiki.x.io上的用途
- pl.wiktionary.org上的用途
- pt.wiki.x.io上的用途
- pt.wikiquote.org上的用途
- ru.wiki.x.io上的用途
- simple.wiktionary.org上的用途
- tg.wiki.x.io上的用途
- zh-min-nan.wiki.x.io上的用途


